Six Times Bigger,
While Growth Is Cheaper
On one side, chip stocks worth 6.4 times what they were the day ChatGPT launched. On the other, the price of a point of earnings growth, falling all year.
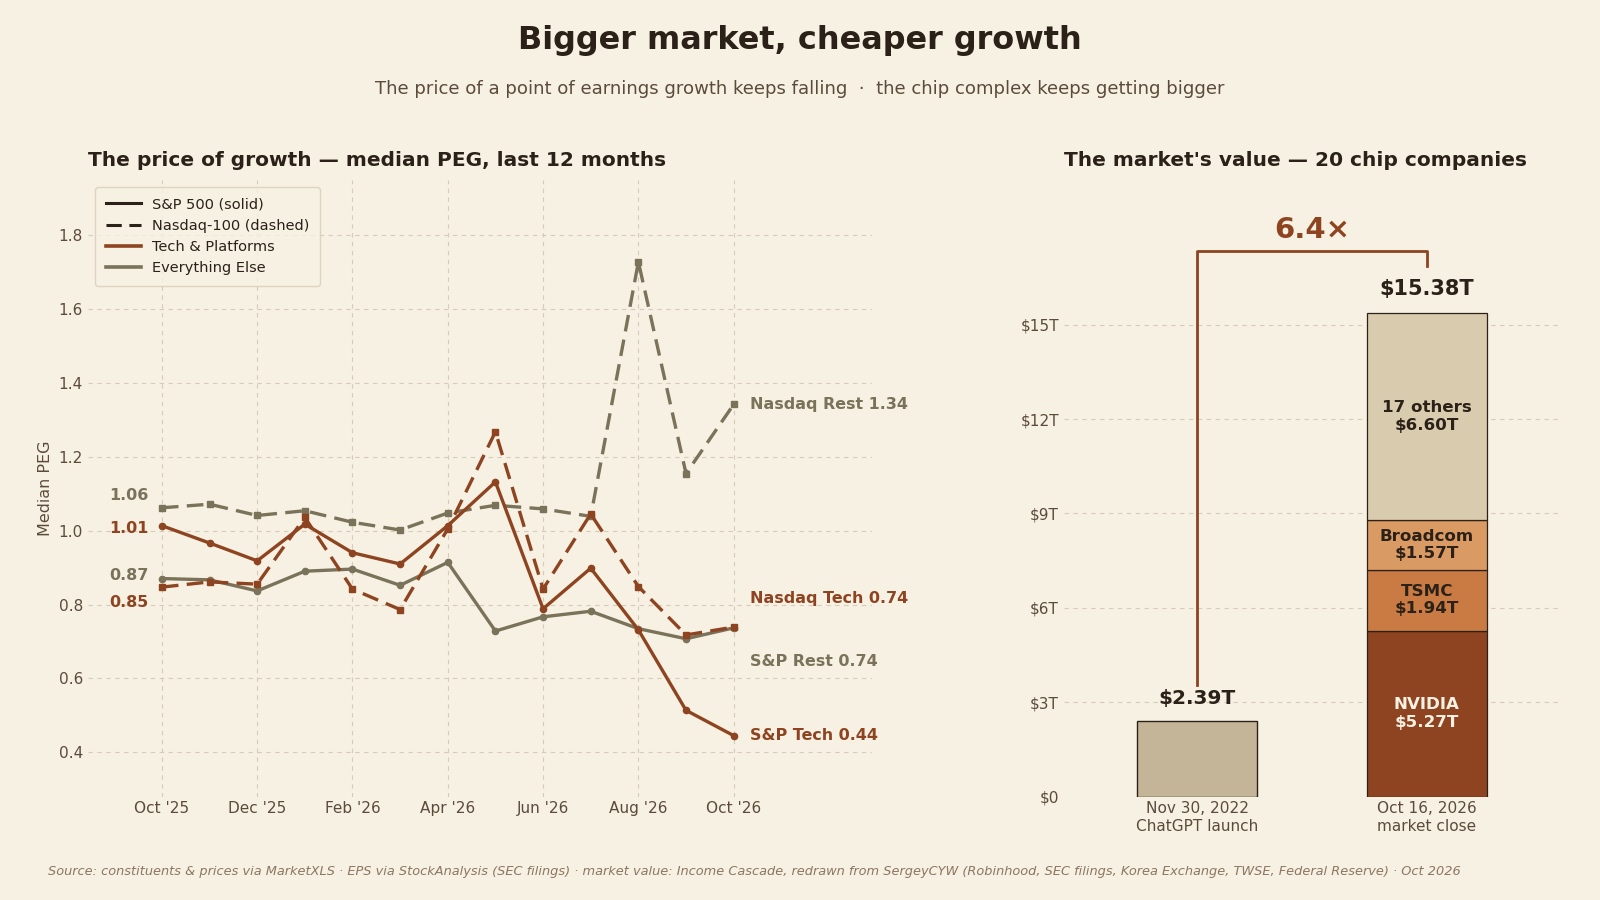
Look at the two panels together, because neither one tells the story alone.
The right panel is the one everyone knows. Twenty semiconductor and AI hardware companies were worth $2.39 trillion combined on November 30, 2022, the day ChatGPT launched. At Friday’s close they were worth $15.38 trillion. Six point four times, in under four years. Nvidia alone is $5.27 trillion of it, about a third of the whole complex.
The left panel is the one that does not fit the bubble story. Over the last twelve months the median PEG on S&P 500 tech and platform companies fell from just above 1.0 to under 0.5. On the Nasdaq 100 it fell from 0.85 to 0.74. Value went up. The price of growth went down. Both at the same time.
What PEG actually measures
A P/E ratio tells you what a stock costs against the earnings it already made. PEG divides that by how fast earnings are growing. A PEG of 1 means you pay one unit of price for one point of growth. Below 1, growth is cheaper than the sticker suggests. Above 2, you are paying up for every point.
That is why the two panels can both be true. Market value can multiply if earnings multiply with it. PEG only rises when price runs ahead of earnings. In tech, price has been running behind.
The right panel: six times bigger
Nvidia is the cleanest case. When ChatGPT launched, Nvidia was worth about $416 billion and had earned about $6 billion over the prior twelve months, roughly 70 times earnings. In the twelve months to July 2026 it earned about $193 billion. Its earnings grew about 32 times. Its market value grew about 13 times, to $5.3 trillion. The trailing multiple fell from about 70 times to about 27 times. The stock went up enormously and got cheaper at the same time, because the denominator grew faster than the price.
The index tells the same story. The S&P 500 traded at 22.2 times forward earnings in January. On October 16 it traded at 19.0 times. Prices did not do that. Estimates did: the 2026 earnings estimate went from about $314 a share at the end of February to about $363 by early October.
The left panel: the price of growth fell
The compression is mostly this year’s work. Through 2025 the tech PEG sat in a range, mostly between 0.85 and 1.0 on the S&P measure. Then the earnings reports kept landing. Quarter after quarter, the growth side of the ratio grew faster than prices, and the lines on the left panel rolled over. S&P 500 tech went from 1.01 last October to 0.44 now. Nasdaq 100 tech went from 0.85 to 0.74.
A snapshot on the freshest October filings makes the same point name by name. Micron prints a PEG of 0.01, a P/E under 12 against earnings growth coming off the memory trough. Nvidia prints 0.22. Meta does not appear in the snapshot at all: its trailing growth prints negative because of a one-time tax charge in the year-ago quarter, so the screen drops it mechanically. The snapshot and the trend are computed two ways, point in time versus latest filings, and they are not blended here. They point the same direction.
Same level as launch day
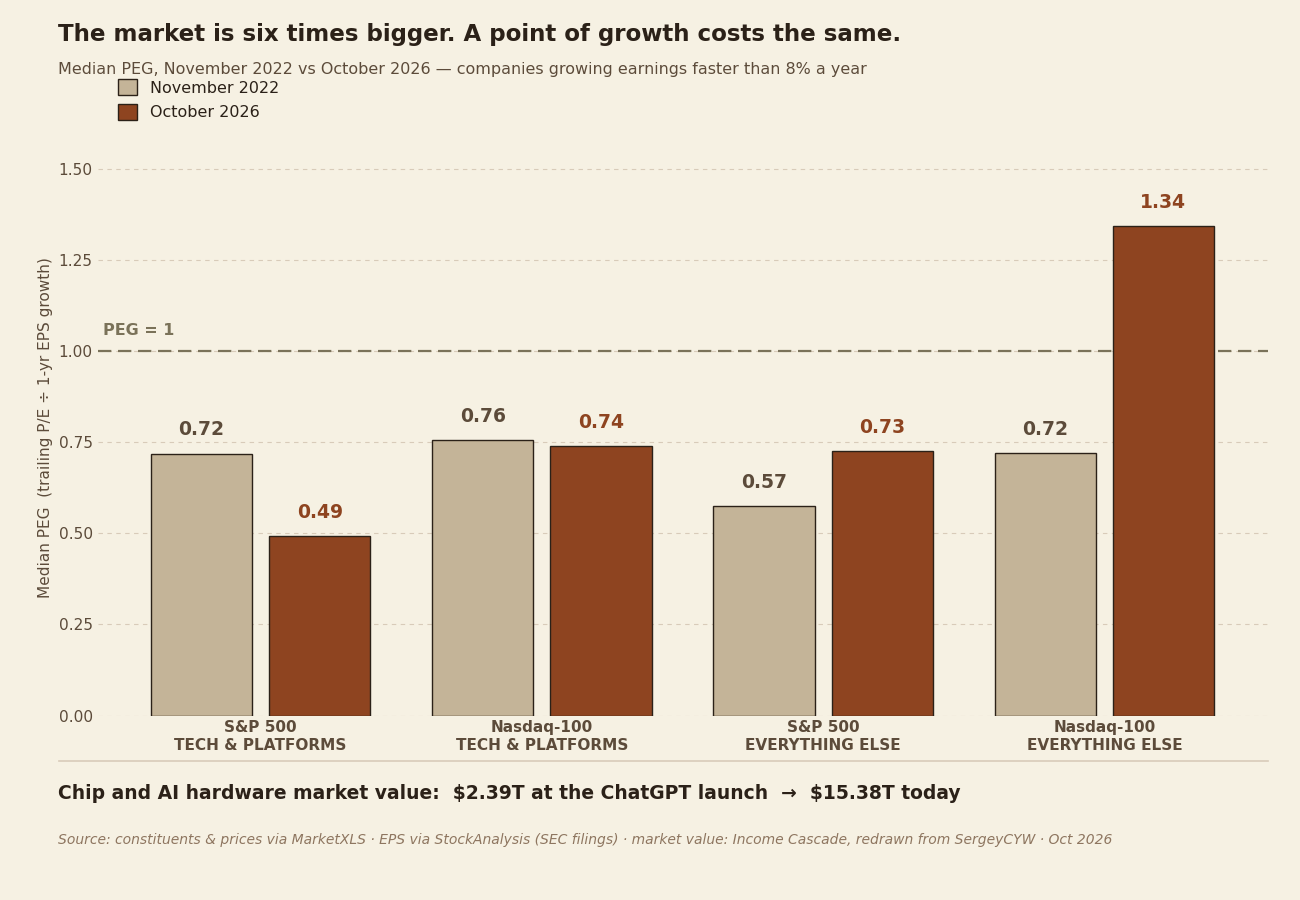
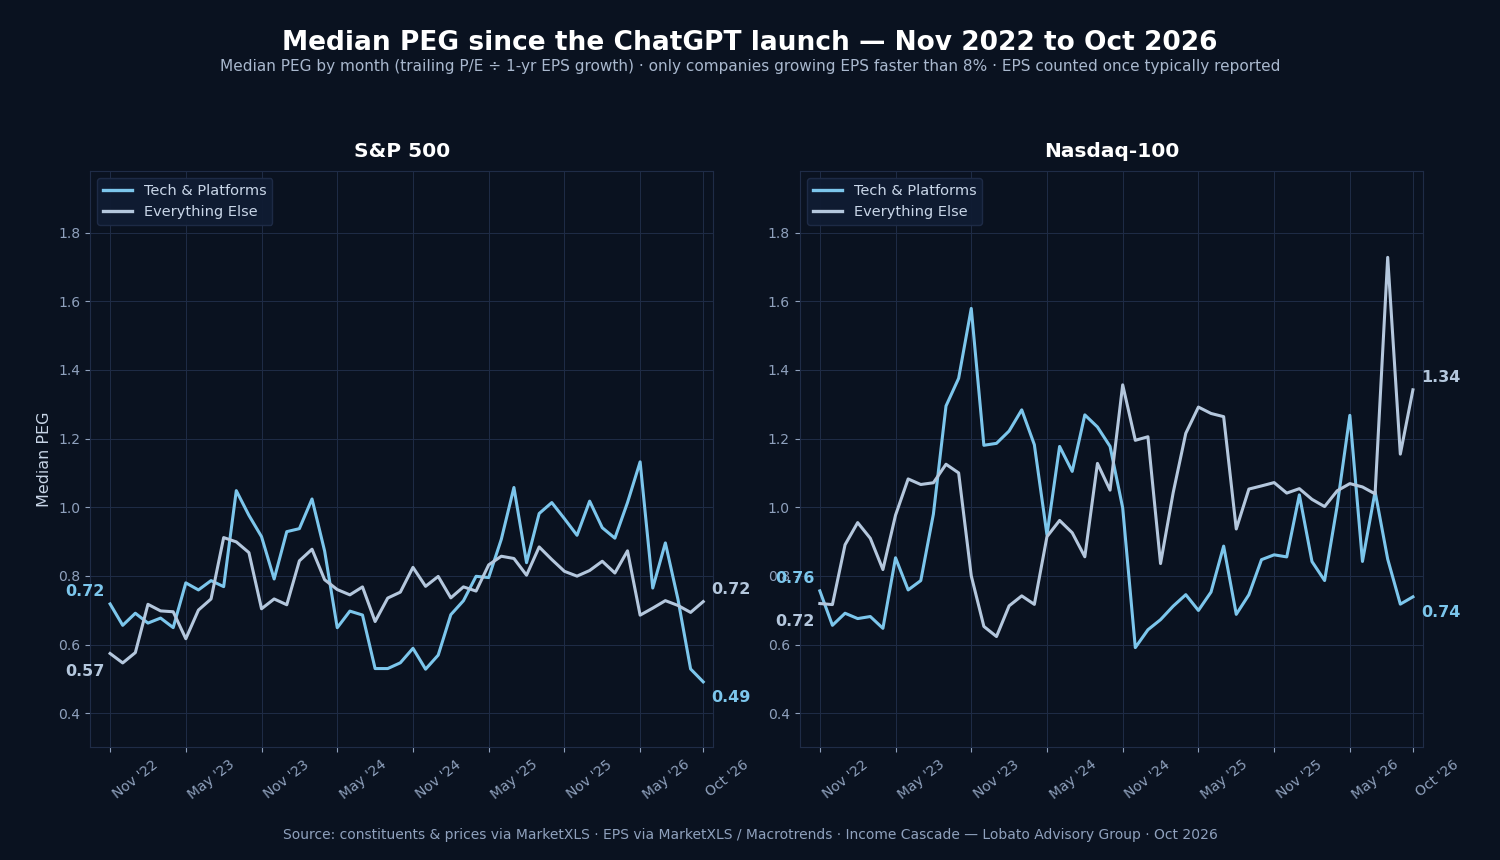
Stretch the left panel back to the start and the picture completes itself. The median PEG on Nasdaq 100 tech was 0.76 in November 2022, the month ChatGPT launched. Today it is 0.74. On the S&P 500, tech went from 0.72 to 0.49. Four years, a market six times bigger, and a point of growth costs what it cost on day one, or less.
The honest caveat
This is a tech story, not a whole-market story, and the left panel shows it if you look at all four lines. Everything outside tech and platforms got more expensive per point of growth. On the Nasdaq 100, the everything else group rose from 1.06 a year ago to 1.34, and against launch day it went from 0.72 to 1.34. On the S&P 500, from 0.57 to 0.73. The Nasdaq group is small, 21 names passing the growth screen, so its median moves around. Still, the direction is clear: the cheap growth in this market is concentrated in the same names everyone calls a bubble.
Cheaper than launch day
The price of a point of earnings growth has been falling and is cheaper than when GPT launched.
The long view says the same. In November 2022, the month ChatGPT launched, the median PEG on S&P 500 tech and platform companies was 0.72. It is 0.49 today. The steepest part is recent: over the last twelve months that median fell from 1.01 to 0.44, as earnings kept arriving faster than prices. Nasdaq 100 tech is the exception, roughly flat against the launch, 0.76 then and 0.74 now.
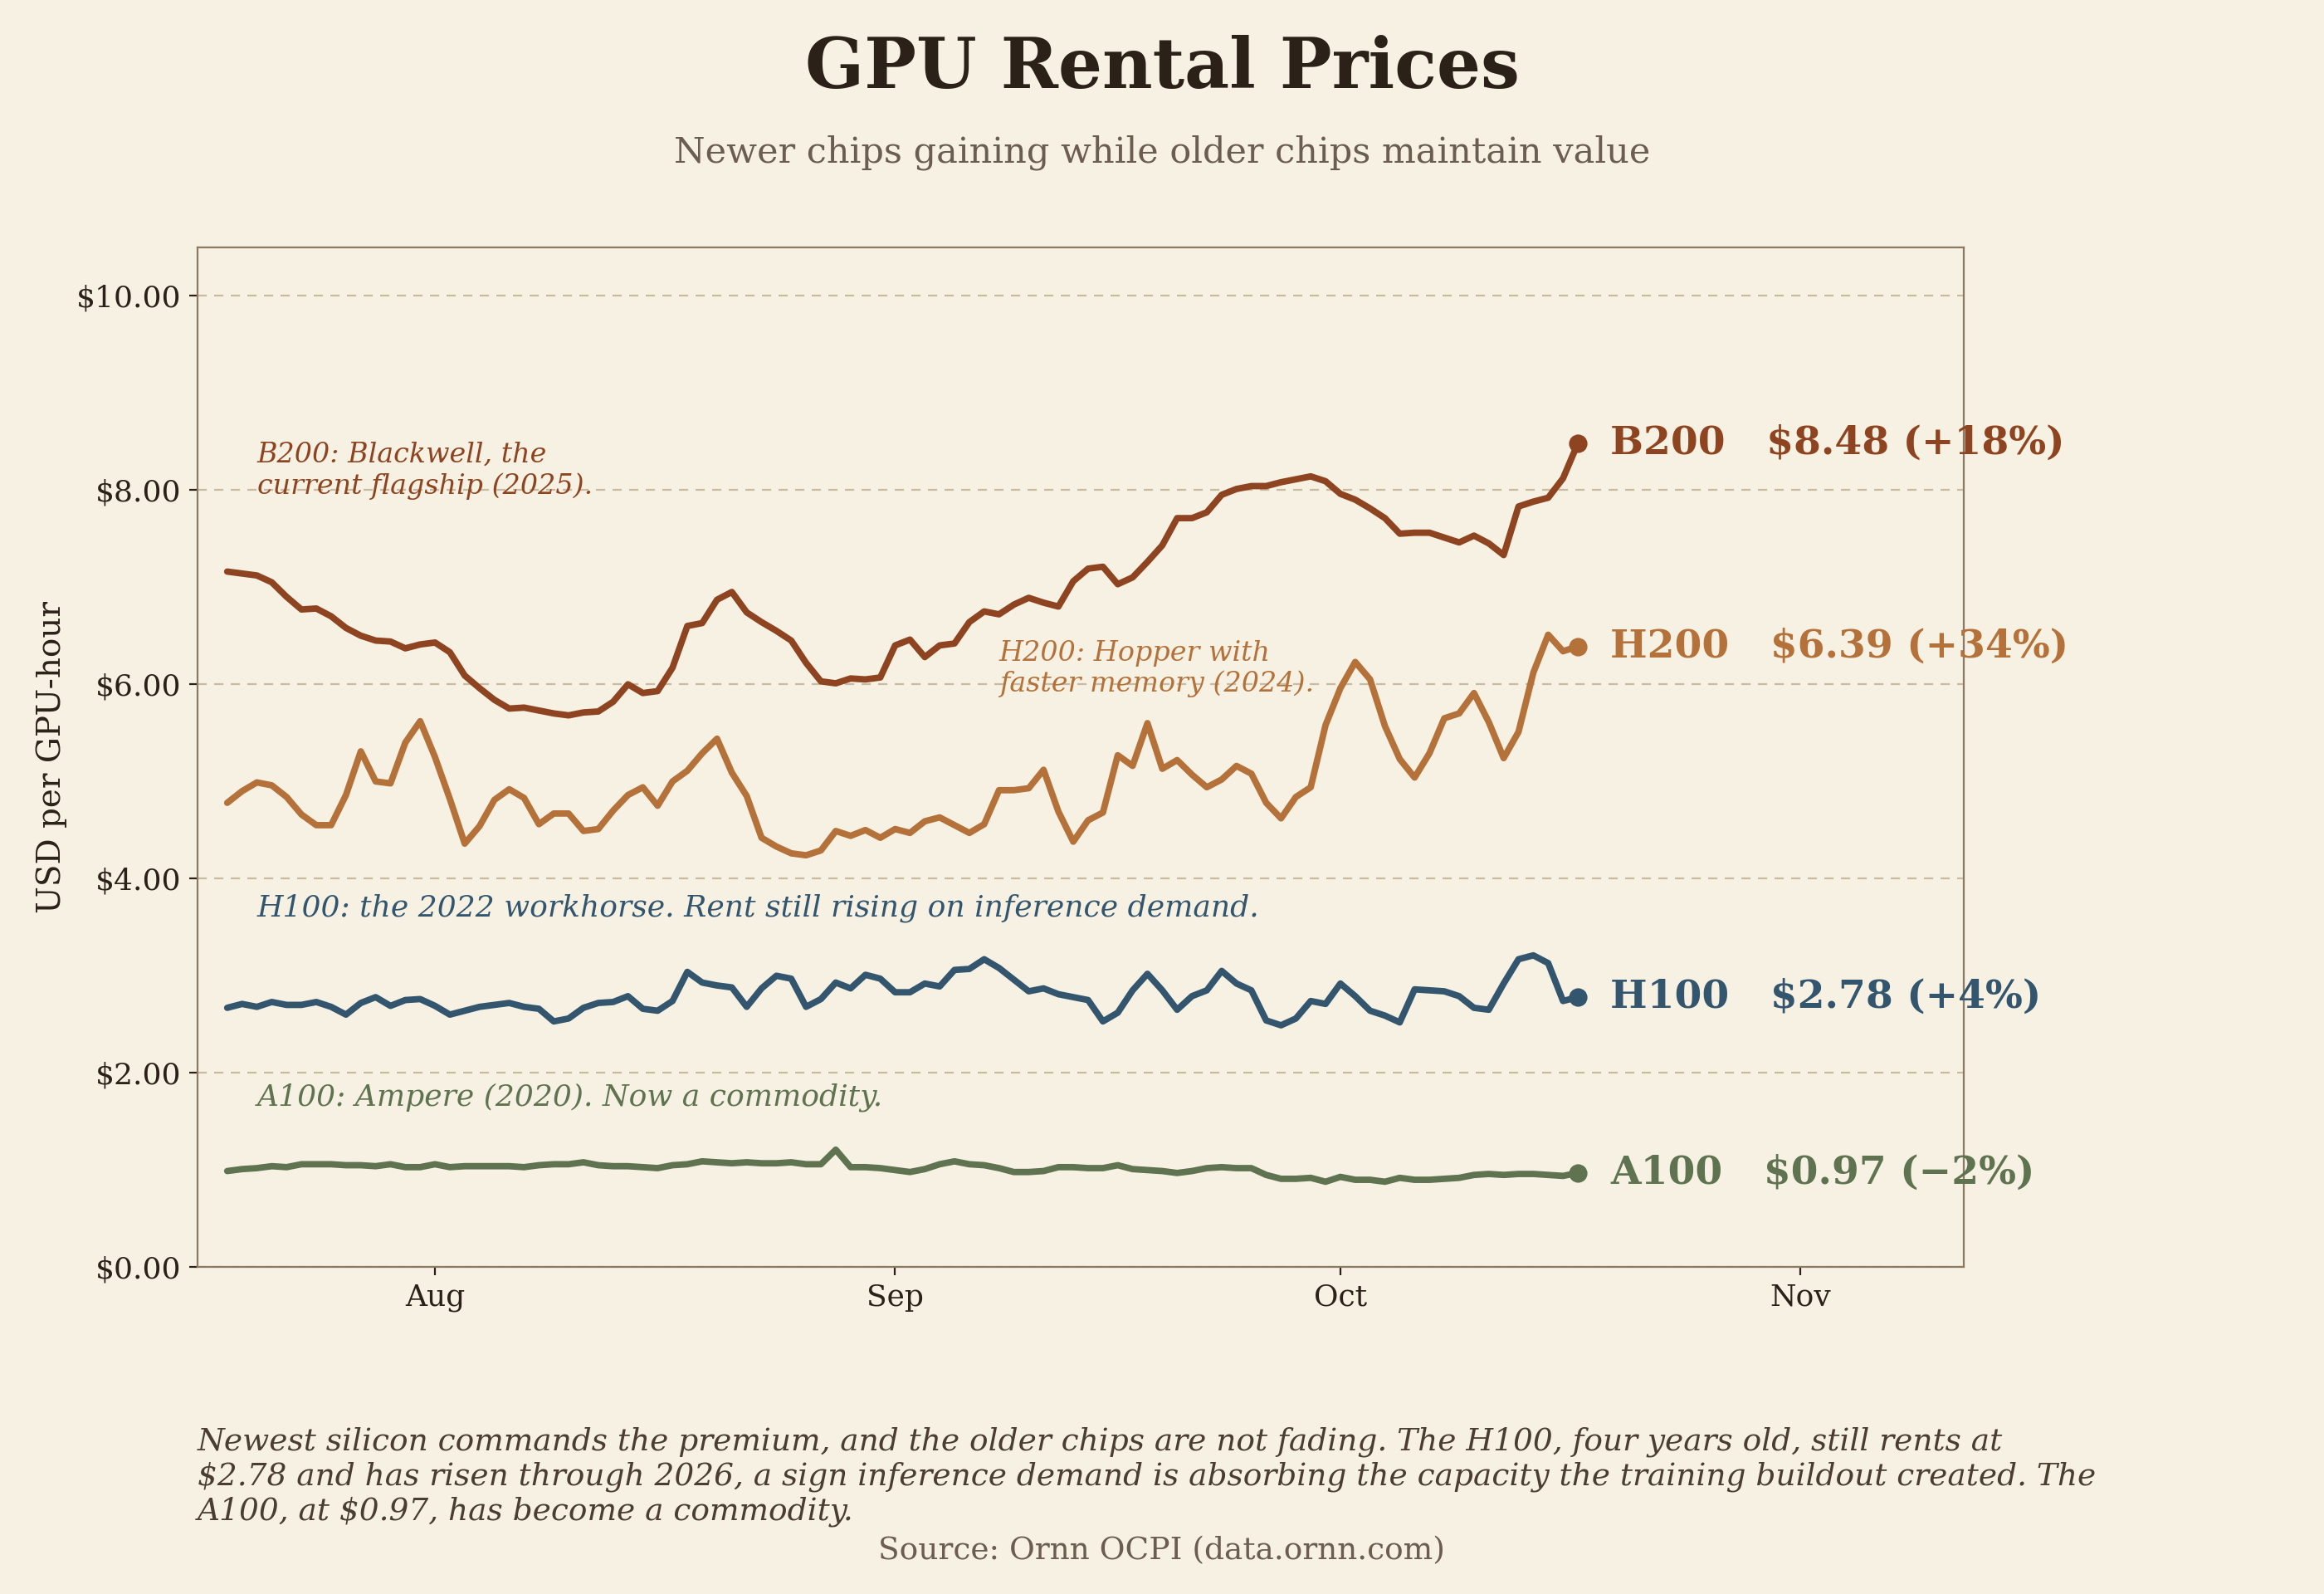
The demand underneath those valuations is visible in what the chips themselves rent for:
The take
The rise in market cap has been fully accompanied by a rise in earnings. Six times the value, a year of falling PEGs, and a price of growth back where it started in November 2022.
To look at market cap growth alone is misleading.
To look at P/E alone without growth is misleading.
The market paid for growth and got more than expected.
Sources: Chip complex market values: Income Cascade, Lobato Advisory Group, redrawn from a SergeyCYW chart and recomputed (sources: Robinhood, SEC filings, Korea Exchange, TWSE, Federal Reserve). PEG trend and snapshot figures: constituents and prices via MarketXLS, earnings per share via StockAnalysis (SEC filings). Nvidia and S&P 500 figures: Income Cascade Monthly Letter, October 2026.