The market makes its money while you sleep
Three decades of S&P 500 returns and twenty-five years of Nasdaq 100 reveal the same strange truth: nearly all the wealth was created between the closing bell and the next morning’s open.
Put $100 into Nasdaq 100 in March 1999 and buy-and-hold grew to $1,518. Own only the overnight return and it reached $5,407. Own only the trading day and it fell to $28. The S&P 500 tells the same story: $100 invested in 1993 became $1,891 with buy-and-hold, $2,003 overnight and just $94 intraday.
The market closes at 4 p.m. The news does not. Earnings land after the bell. Asian and European markets trade. Central banks speak. Wars start, deals break and new information piles up while US investors wait for the next opening price.
That waiting period is not dead time. It is where the market has done most of its work.
The $100 experiment
Start with $100 in the S&P 500 in 1993 and another $100 in Nasdaq 100 in March 1999. Leave each in the market all day and all night. Then compare that with two impossible but revealing portfolios: one owns only the overnight return, the other owns only the trading day.
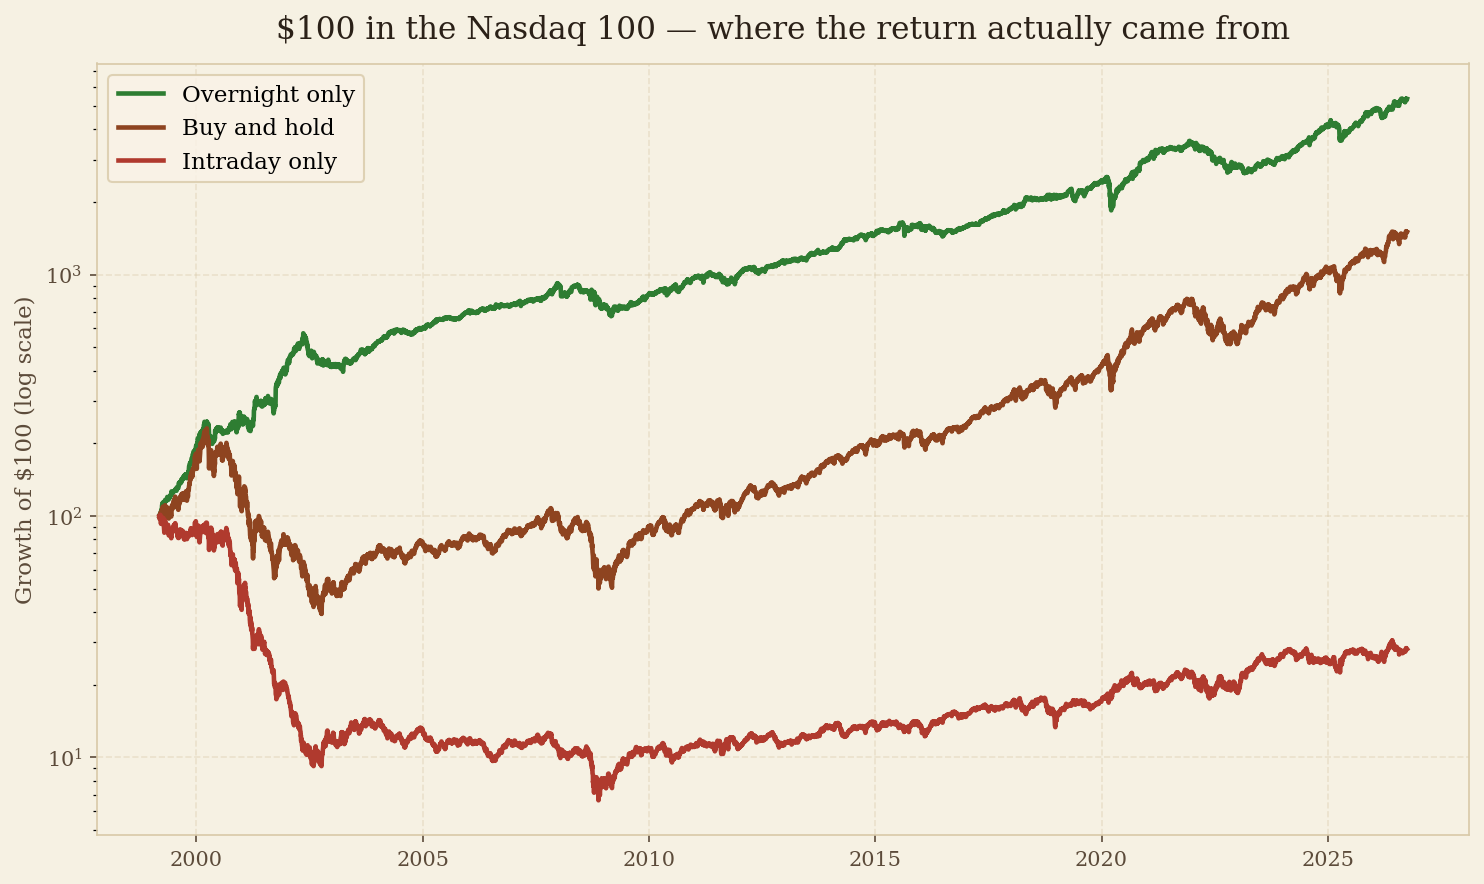
Nasdaq 100
S&P 500
These are return breakdowns, not portfolios an investor could copy exactly. They exclude trading costs, taxes and the difficulty of capturing every open and close.
Nasdaq 100 and the S&P 500 compounded while investors slept. During the trading day, both lost money.
Why the night shift matters
Public markets are built around scheduled sessions, but information arrives around the clock. When the next session opens, prices jump to absorb what happened overnight. That gap from yesterday’s close to today’s open becomes the return.
The effect is strongest in assets whose important information arrives when regular US trading is closed. Taiwan Semiconductor reacts to Asia. Oil responds to geopolitical news. Small companies and high-growth stocks move more when investors’ willingness to take risk changes.
Average yearly return, split between close-to-open and open-to-close.
The night also wins more often. NVDA was positive on 58% of overnights, compared with 52% of day sessions. The edge is not just a handful of giant gaps. It shows up as greater consistency, one night at a time.
The ETF wrapper effect
Bitcoin gives us a clean test because the asset itself never closes. Spot Bitcoin trades around the clock. IBIT, the US-listed ETF that owns Bitcoin, trades on the stock market’s schedule.
The same asset produces two very different return patterns. Spot Bitcoin earned 38.9% a year during US trading hours and only 1.2% overnight. Put Bitcoin inside IBIT and the result flips: 48.5% overnight and negative 16.3% intraday.
Spot Bitcoin
Trades 24 hours a day
IBIT ETF
Trades on US market hours
The wrapper, not the asset, creates the pattern. IBIT has to catch up at the open to everything Bitcoin did while the stock exchange was closed. The price adjustment lands in the overnight return.
This is not just an index effect
The same pattern shows up in some of the market’s biggest individual stocks. Over the past ten years, each one earned far more overnight than it did during the trading session.
Average yearly return over ten years. In dollar terms, $100 held only overnight grew to $6,572 in NVDA and $7,121 in AMD. The intraday-only versions reached just $212 and $129.
The exceptions prove the rule
Not every company follows the overnight pattern. Apple earned just 0.7% a year overnight and 27.5% during the session. Meta earned 6.9% overnight and 11.4% intraday. Google earned 8.5% overnight and 14.4% intraday.
The megacap consumer names earn their keep during the session. Their products, advertising engines and huge shareholder bases are most actively debated and traded while New York is open. The broad market result is powerful, but it is not a law of nature for every stock.
When the pattern reverses
Foreign-market ETFs run on another clock. Japan, developed markets outside the US and China trade in their home markets during the US overnight. The US-listed fund is only one window onto an asset whose prices are mainly being set elsewhere.
Long Treasuries reverse it too. TLT lost 5% a year overnight and gained 1% intraday. Inflation news, central-bank signals and global bond trading do not wait for the New York open. The long-run damage from rising rates showed up mostly while regular US trading was closed, followed by a small daytime recovery.
The exceptions matter. They tell us this is not magic and it is not a mechanical rule to trade. It is a map of when each market absorbs information.
The takeaway: stay invested
The conclusion is simple. The day-trading pitch does not survive this test. Buying the Nasdaq 100 at each open and selling at each close turned $100 into $28. Doing the same with the S&P 500 turned $100 into $94. For these two indexes over these long periods, the wealth was created overnight.
This does not mean every night makes money. It means the market’s long-term return has come from being invested through the night, not from trading the hours between the opening and closing bells. The punchline is plain: stay invested.
Data note: The S&P 500 (SPY) record begins in 1993. The Nasdaq 100 record begins in March 1999. The other asset figures show average yearly returns over the available ten-year period. IBIT begins in January 2024. Overnight means the prior close to the current open. Intraday means the current open to the current close. Daily opening, high, low and closing prices were adjusted on the same basis. Bad opening prices for PLTR and TSM on January 24, 2023 were left out. Figures are rounded. Research data through October 2, 2026. Not financial advice.