The Index Is at Records. Most Stocks Are Not Participating.
The Nasdaq 100 is at all-time highs. But most of the stocks in it are not participating. Two names explain three-quarters of the entire year’s gain.
The Nasdaq 100 is at all-time highs. But most of the stocks in it are not participating. Two names explain three-quarters of the entire year’s gain. That is what the data says. Let me show you.
First, some definitions. Breadth measures how many stocks are rising at the same time. When breadth is wide, most stocks move up together. When it is narrow, a few carry the rest.
The standard way to measure it: count how many stocks sit above their moving average. A moving average is just the average price over the last N days. Above it means uptrend. Below it means downtrend.
Right now, breadth is narrow. Fewer than 1/3 of Nasdaq stocks, around 3,000 names, sit above their 50-day moving average. That is well below the historic norm.
The Nasdaq 100 is holding up better. 48% of its large caps sit above the 50-day. The weakness is concentrated in the smaller names outside the 100.
But that is not the interesting part. The interesting part is what the big stocks are doing underneath the surface. Correlation between stocks has fallen to almost nothing. The gap between winners and losers is 47 percentage points in a single month.
Here is what that looks like.
Breadth across timeframes
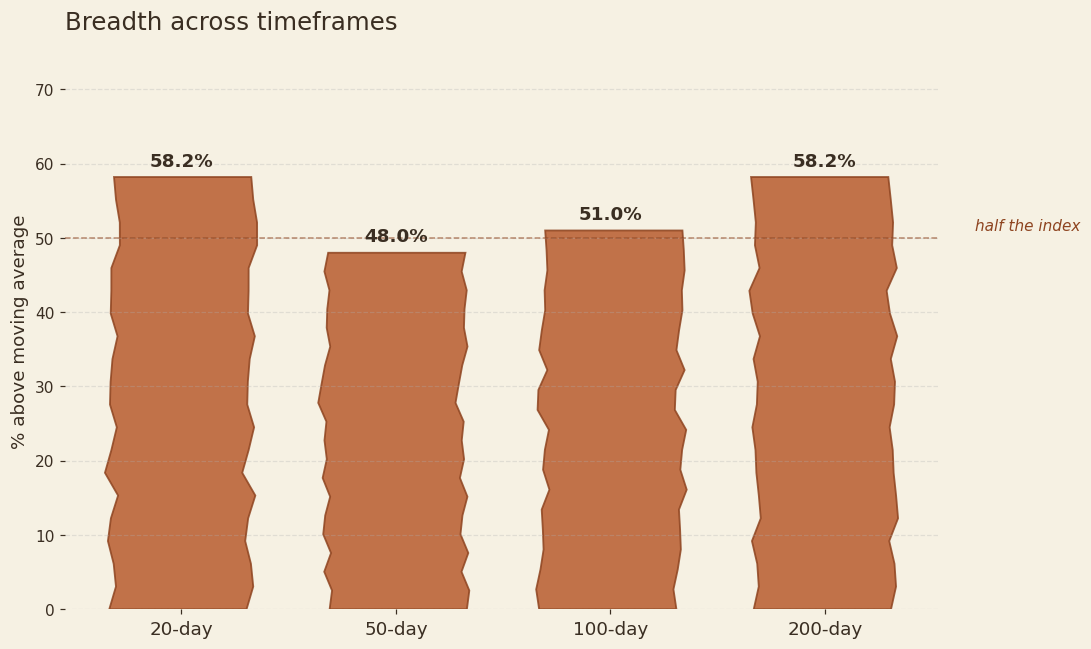
Here is the full picture, as of the October 5 close. And it is weak against history.
58% sit above the 20-day. 48% above the 50-day. 51% above the 100-day. 58% above the 200-day.
The 50-day is the soft spot. Everything else looks healthier. The 200-day matches the 20-day at 58%, which tells you the long-term trend is intact. The intermediate trend is where stocks are struggling.
Against the 5-year average, every timeframe is below norm. The 50-day sits at 48% versus a 55% historic average. The 100-day at 51% versus 58%. Even the 200-day at 58% trails its 62% norm. Breadth is not just narrow. It is narrow for this market.
35 stocks sit above all four moving averages. 30 sit below all four. 33 are mixed, caught in between.
So breadth is narrow but not broken. That is the first takeaway. The second one is where it gets interesting.
Two stocks are the index
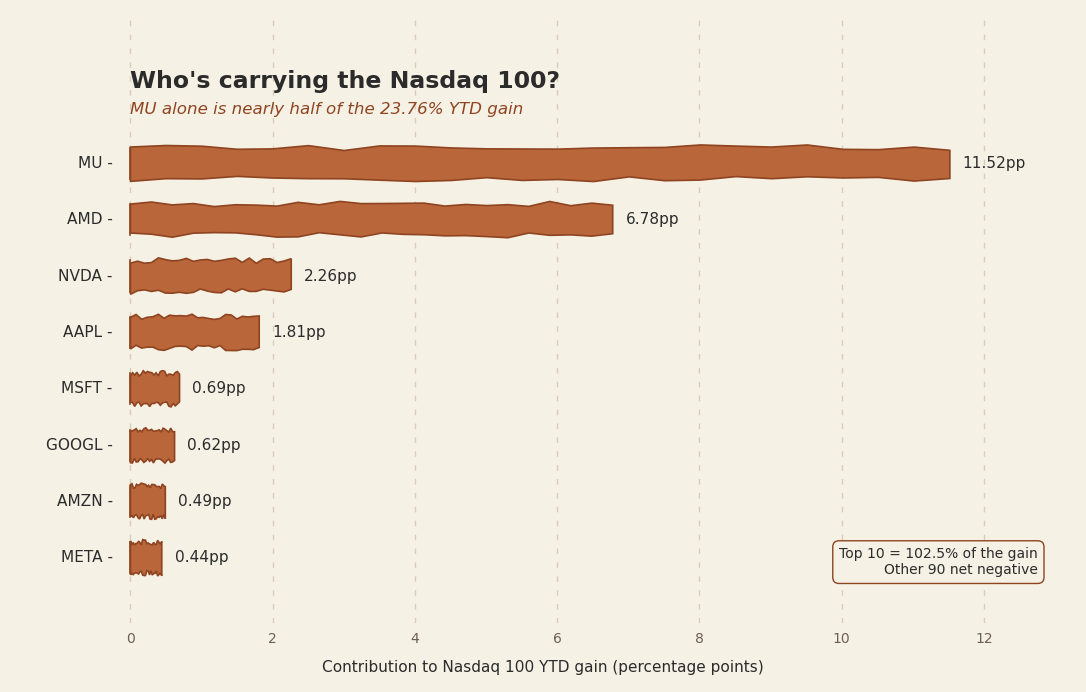
The Nasdaq 100 is up 23.76% this year. Here is where that gain came from.
Micron is up 237.5%. At a 4.85% weight, that single stock contributed 11.52 percentage points to the index. Nearly half the entire year.
AMD is up 182.7%. At a 3.71% weight, it added 6.78 points.
Together, MU and AMD account for 77% of the Nasdaq 100’s gain this year. Two stocks. Three-quarters of the return.
The top 10 contributors account for 102.5% of the gain. Read that again. The other 90 stocks, combined, are net negative on the year. The index is at records because a handful of memory and AI names carried it there.
Correlation has collapsed
Correlation measures how much two stocks move together, on a scale from negative 1 to positive 1. A correlation of 1 means they move in lockstep. Zero means they move independently. Negative means they move in opposite directions.
Here is the number that surprised me most. The average pairwise correlation between Nasdaq 100 stocks over the last 60 trading days is 0.073.
In a normal market, that number runs between 0.30 and 0.50. Stocks move together because they share the same macro drivers. At 0.073, these stocks are barely talking to each other. Each one is moving on its own story. Earnings. AI exposure. Positioning. Not the group.
The average correlation to the index itself is only 0.205. Even the Nasdaq 100 barely explains what its own components are doing.
The stocks most correlated to the index are all semis and AI names. INTC at 0.80, ALAB at 0.79, LRCX at 0.75, AMD at 0.75, ARM at 0.73. The index IS the AI trade right now.
The least correlated are the defensives. MDLZ at negative 0.41, ROP at negative 0.41, ADP at negative 0.37. They zig when tech zags. In a market this concentrated, that is exactly what you would expect.
Dispersion is extreme
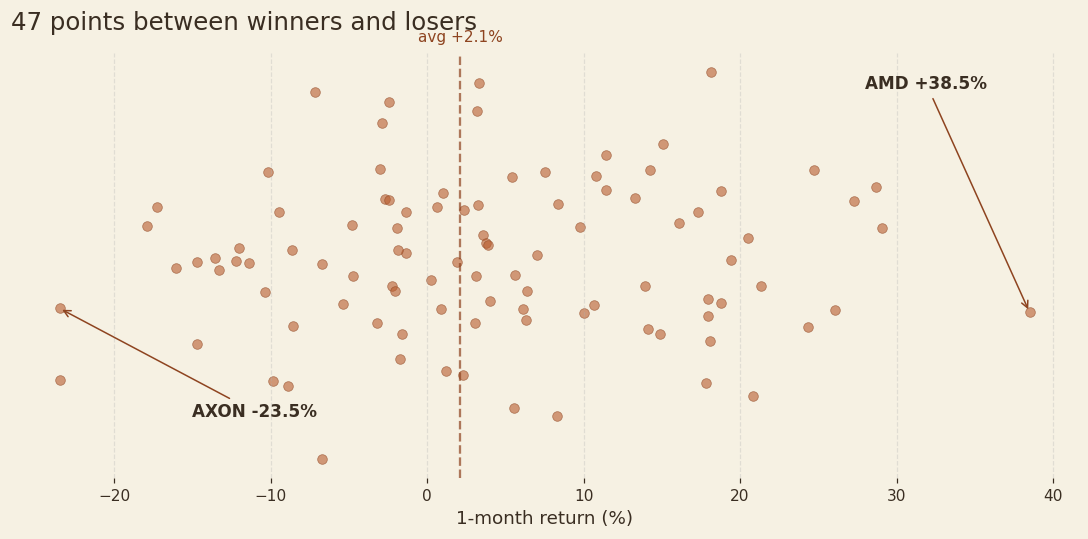
The one-month return spread between the top and bottom deciles is 47 percentage points. That is enormous.
AMD gained 38.5% in a month. AXON lost 23.5%. The top 10 monthly winners are almost entirely semis and AI infrastructure. The bottom 10 are software, media, and defensives getting sold.
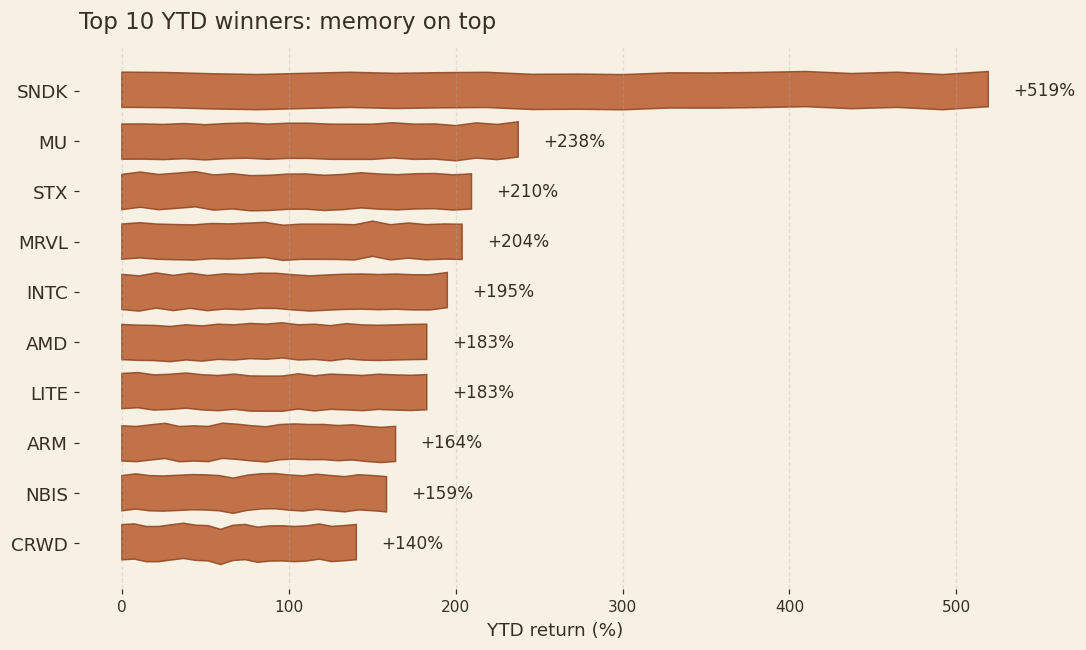
The full-year picture is even more dramatic. SNDK is up 519% on the year. MU is up 238%. At the other end, APP and INTU are both down 54%. Memory is on top. Software is getting crushed.
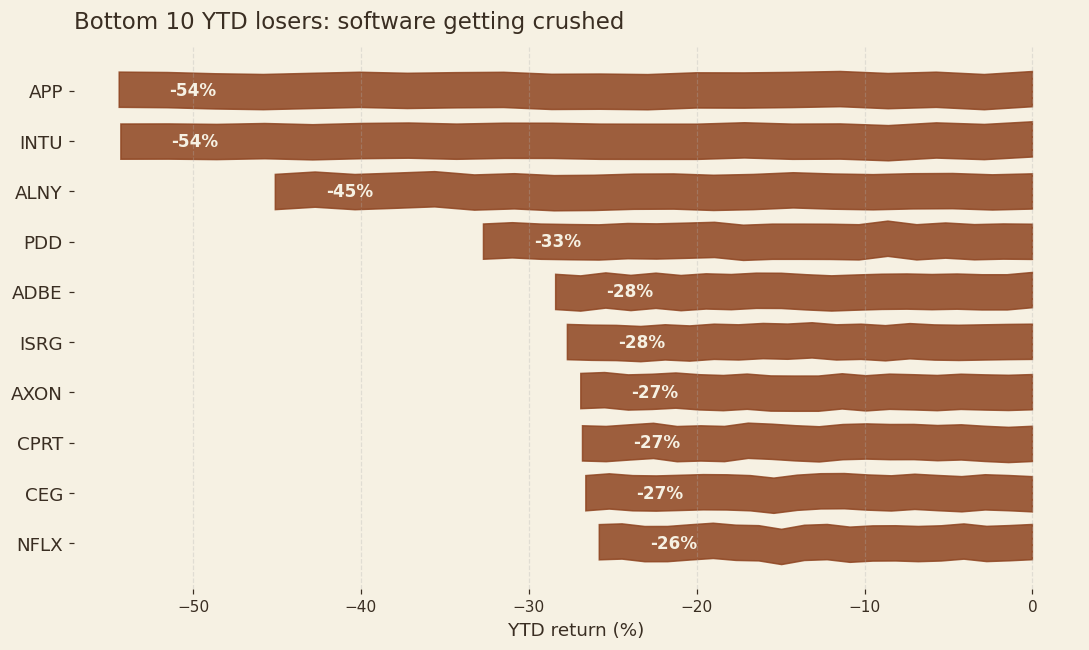
This is a stock-picker’s market, not an index market. The index return tells you almost nothing about what individual stocks did.
RSI check
RSI stands for Relative Strength Index. It measures how fast a stock has been going up versus down over the last 14 days, on a scale of 0 to 100. Above 70 means overbought, the stock has run too far too fast and often pulls back. Below 30 means oversold, it has fallen too far too fast and often bounces.
The Nasdaq 100 itself sits at an RSI of 82.3. That is deeply overbought by any standard.
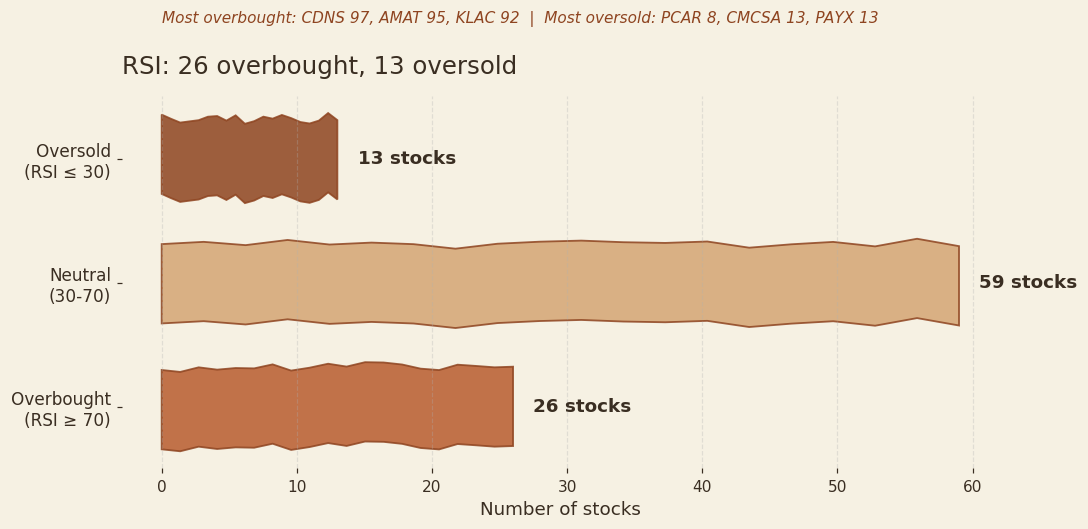
Across the index, 26 stocks have an RSI above 70. The most extreme: CDNS at 97, AMAT at 95, KLAC at 92. All semis. All screaming.
13 stocks sit below 30. PCAR at 8, CMCSA at 13, PAYX at 13. Those are the names the market has given up on.
So what
Here is what this means for how I think about the market right now.
First, know what you own. The Nasdaq 100 is up 24% and at records, but two stocks did most of the work. MU and AMD together explain 77% of the year. That is not a flaw in the index. It is how cap-weighted indices work. The winners get bigger and carry more weight. Just be clear-eyed about it.
Second, the low correlation is worth noting. At 0.07, these stocks are moving on their own stories, not as a group. That means stock selection matters more than usual. The index gives you the theme. The individual names give you the dispersion.
Third, this is a stock-picker’s market. A 47-point gap between monthly winners and losers means picking right matters more than being invested. The index return is real, but the real action is in the tails.
The 200-day breadth at 58% says the long-term trend is intact. This is not a sell signal. It is a reminder that concentration cuts both ways. When two names lead, they can keep leading. Just know where your return is coming from.
Watch what people do, not what they say. Right now they are buying memory and selling software. That is the whole market.
Data note: MarketXLS daily closes through October 5, 2026. Nasdaq 100.